Anneli Xie
Prof. Matt Kaliner
SOC 225: Urban Studies and Policy
2018/10/03
Prof. Matt Kaliner
SOC 225: Urban Studies and Policy
2018/10/03
tags:
#urbanstudies
#wellesley
The process of cognitive mapping: Boston as a physical city scape and a social fact
A process not often paid attention
to, navigating and understanding our surroundings is an essential part of our
everyday lives. We all inherit a cognitive map subconsciously guiding us
through our spatial environment; a map that can be a revealing factor in
unveiling our identities – both as individual people and as agents within
social institutions. In 1960, urban planner Kevin Lynch proposed a theory of
cognitive mapping in his book The Image
of the City, in which he discusses the element of legibility as crucial to
a city. Legibility, he means, is “the ease with which [the city’s physical]
parts,” (1960:3) such as paths, landmarks,
edges, nodes, and districts, (1960:47) “can be recognized and [...] organized
into a coherent pattern.” (1960:3) A well-legible city, Lynch argues, provides
a sense of emotional security, which in turn helps guide the rest of our
environment. (1960:4) In contrast, rather than focusing on the physical
elements of a city, social psychologist Stanley Milgram in his essay Cities as Social Representations (1984),
discusses the understanding of our surroundings as “the products of intensive
and prolonged social activity, containing the material embodiments not only of
one's contemporaries, but of the accumulated labors, decisions, and values of
earlier generations.” (1984:293) Rather than Lynch’s emphasis on the city as
existing purely in a physical dimension, Milgram attributes cognitive mapping
to our social identities and the city as a social fact, arguing that we
navigate our surroundings based on bias from previous experiences, as well as
the biases of the people around us. (1984:301)
The aim of this paper is to examine the intersection between Milgram and Lynch’s theories of cognitive mapping through the levels of fear people experience in the city of Boston, MA. This will be done by a method developed by Sorin Adam Matei and Sandra Ball-Rokeach, applied in their 1998 study “Watts, the 1965 Los Angeles Riots, and the Communicative Construction of the Fear Epicenter of Los Angeles.” Drawing on my own research, carried out on September 27, 2018, I will investigate how certain physical elements of the city has an ability to trigger fear, and how social factors such as gender and race affect our understanding of the city as a social fact, in relation to the areas that we avoid or find fearful.
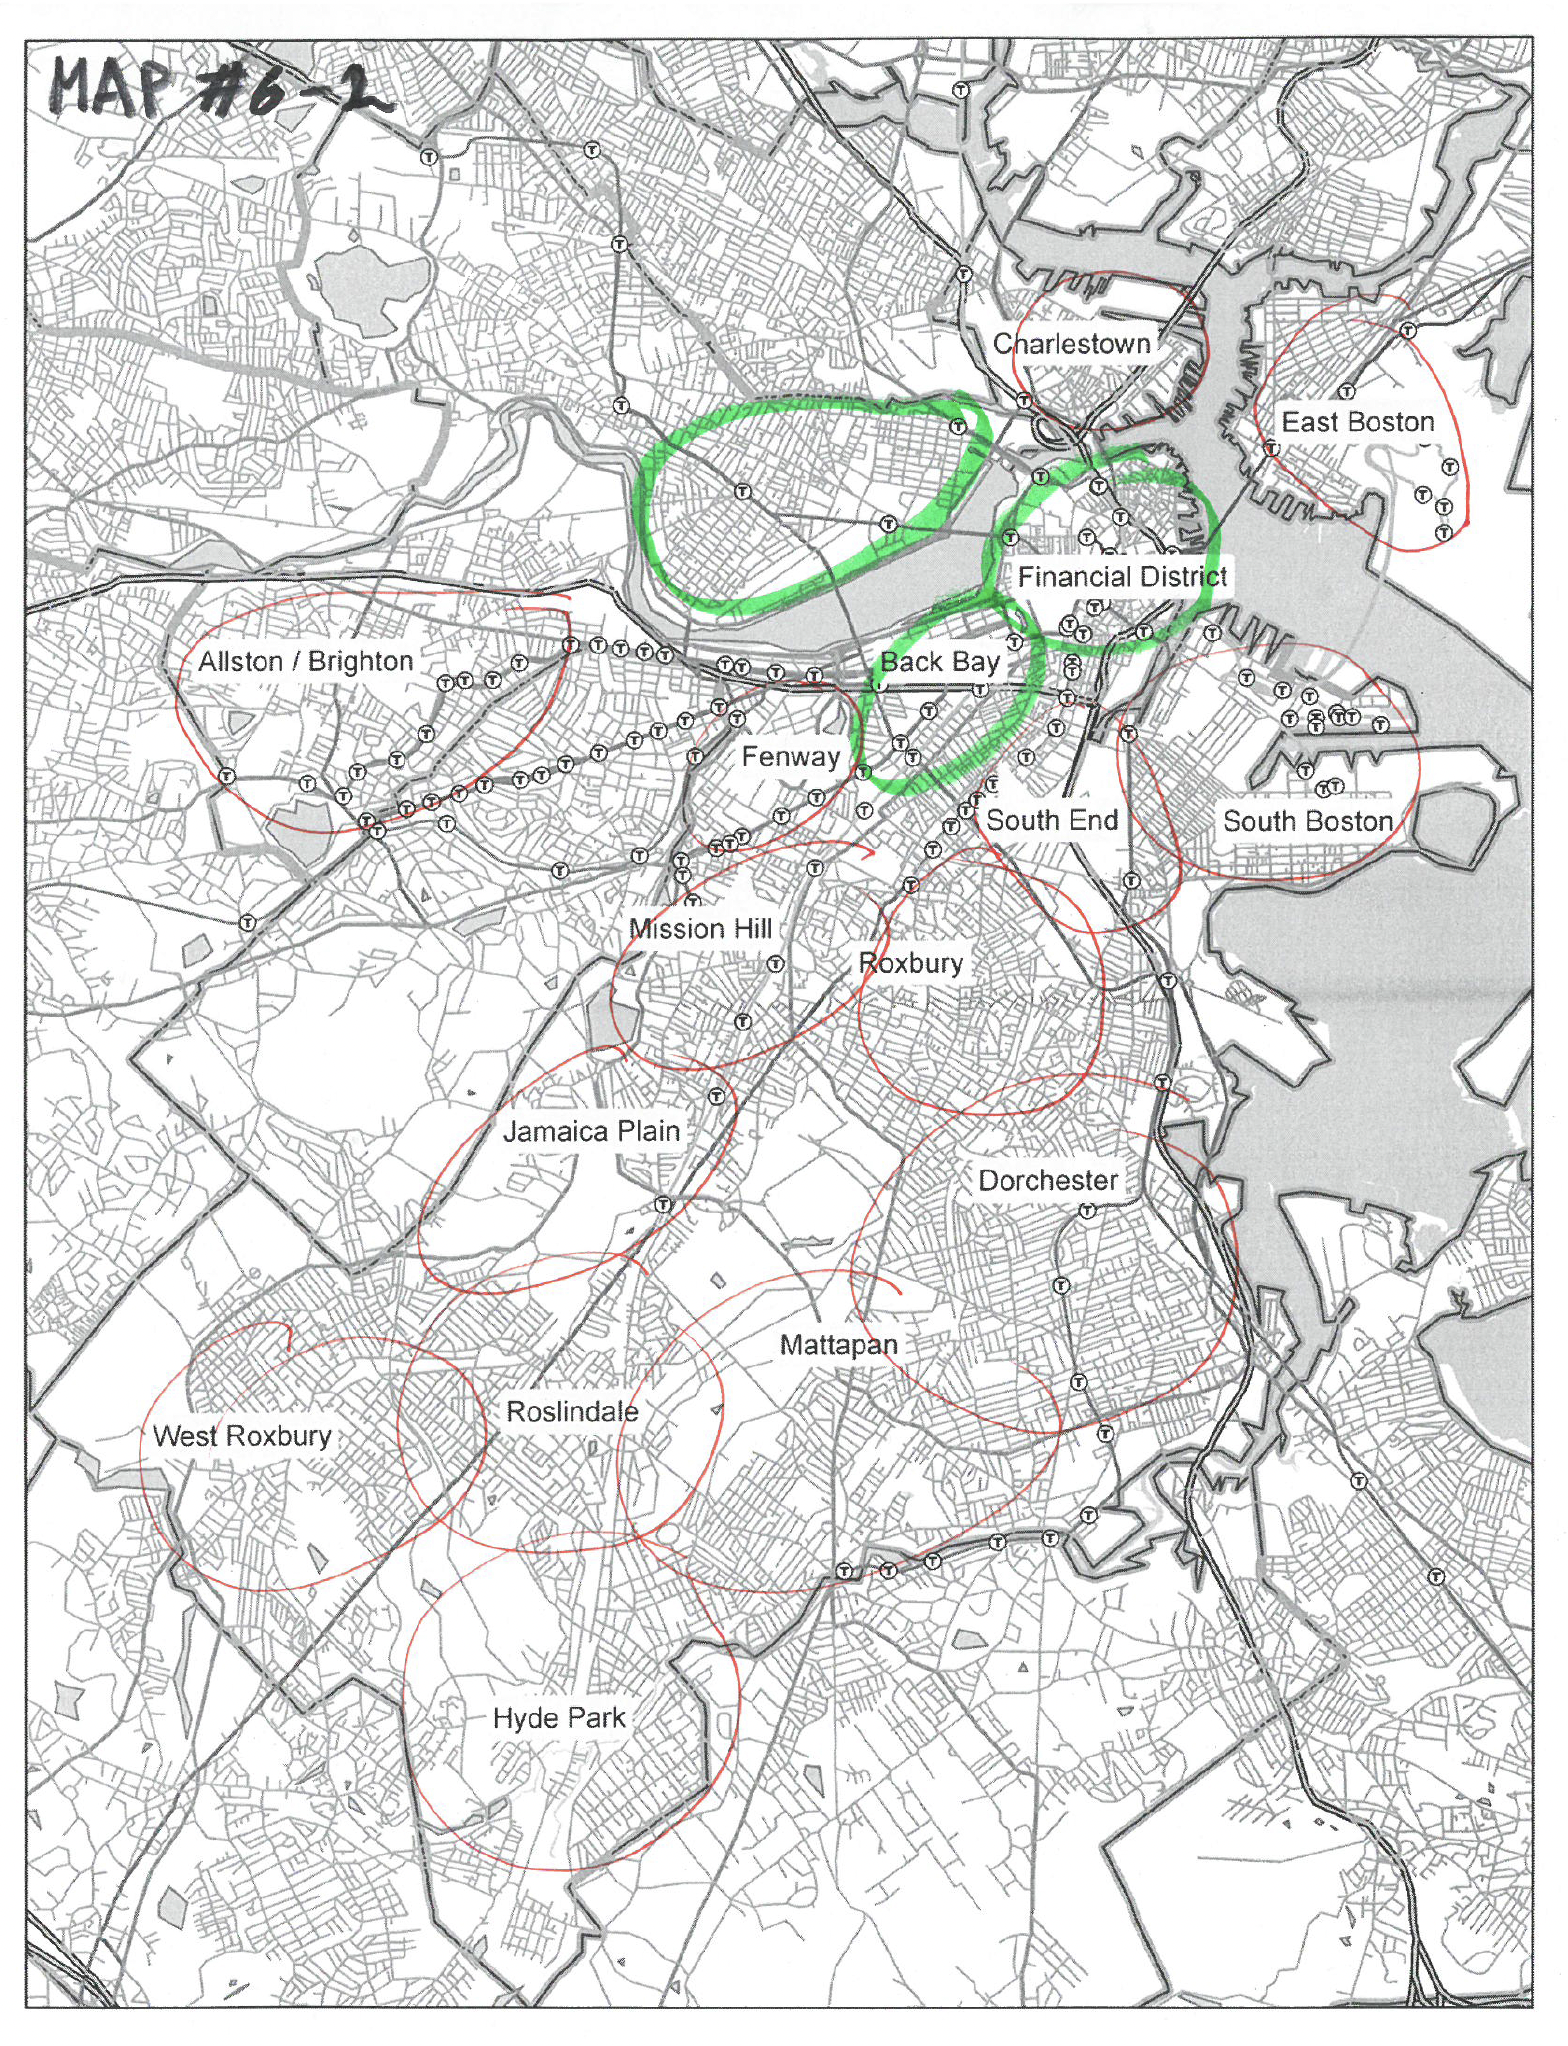
Matei and Rokeach’s study made remarkable findings on the subject of spatial fear by utilizing the process of cognitive mapping. In conducting their research, Matei and Rokeach asked participants to fill out black and white maps of Los Angeles with colored markers indicating the different levels of fear and comfort they felt while moving through the city. The color red was applied for high levels of fear, green for areas of comfort, and orange for areas in-between the two. (1998:310) Applying this method to my own research, I printed black and white-Boston-maps, with symbols marking out the different subway stops and labels distinguishing each district from the other. Similarly to Matei and Rokeach, I asked my participants to mark out areas on the map in red or green, but lacked an orange pen and instead asked participants to mark areas ‘somewhat, but not completely comfortable,’ in blue. I also asked my participants to accompany their map with an informal interview, in which they had to – in as much detail as they were comfortable with – explain their choice of coloring to me. These informal interviews were recorded in real-time by bullet points, and later in voice recording, after I had left the subject and interview area. All interviews were conducted during the daytime and were carried out in the areas of Central and Kendall in Cambridge, and Back Bay in Boston, MA.
In my sample, I wanted an equal division of men and women and an equal division of white people and people of color. This was desired in order to compare and contrast my results within the two groups. In order to extract these factors as defining, I decided to sample only young adults (20-30 years old) having lived in Boston for at least four years. Who I approached in turn measured up to this standard, as well as who looked like they were in a leisurely setting. I approached 17 people that were eligible to participate, but got rejected by more than half, and ended up with six interviews and their accompanying maps. All participants ranged from 20 to 30 years of age, with an equal division of Caucasians and people of color (three and three, respectively.) Of the six interviews, three of the subjects were women, two were men, and one identified as non-binary. Since I selected my participants based on the two comparative groups of gender and race, I have also chosen to analyze my data in regards to these two aspects. In analyzing my data, I wanted to answer questions such as: how do different genders perceive the city differently, and how much does race impact your thoughts and feelings towards your surroundings, as well as: what physical components have the ability to make a city more fearful, and how do these differ depending on gender and race?
Starting with the aspect of gender, I found a big discrepancy in answers received from all gender groups (male/female/non-binary). Most notably, all three women (Appendix B, E, and F) and the non-binary person (Appendix A), marked several spots in red, whereas the male subjects (Appendix C and D) marked significantly fewer. When asked about their decisions, all non-male subjects attributed at least some of their red markings to areas where they had previously experienced sexual harassment by men, with examples including fondling, cat-calling, and being followed. (See Appendix A, B, E, and F) All non-male subjects experienced another degree of fear during night time, with many of them mentioning that empty streets and bad lightning made them feel unsafe. (See Appendix B, E, and F) Areas also frequently avoided were areas of little public activity during night time – places far away from the subway lines, as well as residential areas. (See Appendix A, B, and F) In contrast, my male subjects felt much more confident in the city. Subject D even went as far as to start his map by saying that he felt safe in all of Boston, and proceeded to circle the districts around the Charles River with great determination. When encountering areas such as Dorchester, Jamaica Plain, and Mattapan, however, he became more hesitant, but proceeded to say that people fearing those areas were “just prejudiced.” (See Appendix D) When asked to explain his statement, the subject revealed that he grew up with his parents’ view of the urban core as a place of danger, dirt, and delinquents. As he had moved out he had explored many of Boston’s different districts alone. “Urban cores change a lot,” he mansplained to me while handing back his all-green map, “they’re not what people think they are – and they’re nothing like what my parents kept telling me to stay away from when I grew up.” (See Appendix D)
Similarly, the comparison of race within my sample gave some interesting results. A general trend was that the three people of color (A, C, and F), regardless of gender, in general, marked more areas in red than their white counterparts (B, D, and E). What is also notable is what areas they marked in red. For example, subject A identified as Latinx and crossed out the Financial District and Back Bay, and put bright red stars on the Logan International Airport and the police station in Jamaica Plain. The feeling of fear surfacing around the airport and the police station was attributed to a feeling of always being aggressively interrogated for no reason, whereas the big cross out of the Financial District and Back Bay was due to the discomfort of being in a business surrounding where “they’re all white, rich, and business casual – and I’m not.” (See Appendix A) Similarly, the red markings by subject C, a Nepali, showed some discomfort around white peoples, most obvious when the subject marked out Cambridge in green, explained that there weren’t a lot of white nor black people in the area, but rather lots of Latinx and Asians, which made him feel safe. Contrastingly, subject D, a white man, marked all areas in green, and subject E, a white woman, did the same – with the exception of the area of Dorchester, which she proceeded to mark in blue due to her friend’s recommendations. (See Appendix E)
My research suggests that we experience the city of Boston very differently depending on what gender and race we identify as, and that this, in turn, biases our experience of the city. For example, a woman will, in general, because of their gender, tend to avoid certain areas due to fear of being physically hurt or sexually harassed. These areas, however, seem to correspond to certain physical elements of the city, with dark areas or areas not easily accessible by public transport (such as the T) being the ones most frequently avoided. Similarly, the spatial fear of a person of color seems to be a mixture of both Lynch and Milgram’s proposals, with people of color expressing fear of being unjustly interrogated and surveilled, as well as scorned at; a feeling triggered by the physical elements of the wealthy district, such as newly constructed skyscrapers and logos of banks and other finance companies. In contrast, my findings show that men express less fear of navigating through the city and inhabit no fear of sexual harassment. The areas avoided, if any, are areas described as “sketchy” due to little commercial activity. The discrepancy between a person of color and a white person’s experience of the city is similar; a white person will express no fear of being interrogated or surveilled and will express more confidence in areas that they have biases about, such as the ethnic neighborhoods of Dorchester and Roxbury. The city is thus, much like Milgram proposed, a social fact, having the power to affect our subconscious and our relation to the spatial environment; but also, as Lynch proposed, a space of potential legibility which subconsciously guides us through the level of emotional comfort it is able to provide.
However, the research I have conducted is incredibly biased due to my small sample, and will inherently be biased by my own views of the city as a woman of color, due to who I felt comfortable approaching, and who in turn felt comfortable participating. Also noteworthy is that subject E was the only one to mark anything in blue, even though I told all my subjects to mark areas they deem to be inbetween safe and unsafe in blue. This could be blue, unlike orange or yellow, is not associated with being in-between, but is instead regarded as quite neutral – or maybe I wasn’t clear enough in my instructions. Another potential bias was the note-taking and voice recordings in which I recalled my interviews. Since most of my interviews were a flowing conversation, it was hard to take exact notes of what the subject was saying, and I will have inevitably only jotted down the things I myself found the most interesting or noteworthy. It would also be preferable to collect a bigger sample of data and to collaborate with researchers of other demographics in order to eliminate bias and get a more objective result.
Ball-Rokeach, Sandra., and Sorin Adam Matei. 2005. “Watts, the 1965 Los Angeles Riots, and the Communicative Construction of the Fear Epicenter of Los Angeles.” Communication Monographs 72(3):301-323.
Lynch, Kevin. 1960. The Image of the City. Cambridge, MA: The MIT Press.
Milgram, Stanley. 1984. “Cities as Social Representations.” Pp. 289-309 in Social Representations, edited by Robert M. Farr, and Serge Moscovici. Cambridge: Cambridge University Press.
The aim of this paper is to examine the intersection between Milgram and Lynch’s theories of cognitive mapping through the levels of fear people experience in the city of Boston, MA. This will be done by a method developed by Sorin Adam Matei and Sandra Ball-Rokeach, applied in their 1998 study “Watts, the 1965 Los Angeles Riots, and the Communicative Construction of the Fear Epicenter of Los Angeles.” Drawing on my own research, carried out on September 27, 2018, I will investigate how certain physical elements of the city has an ability to trigger fear, and how social factors such as gender and race affect our understanding of the city as a social fact, in relation to the areas that we avoid or find fearful.
Matei and Rokeach’s study made remarkable findings on the subject of spatial fear by utilizing the process of cognitive mapping. In conducting their research, Matei and Rokeach asked participants to fill out black and white maps of Los Angeles with colored markers indicating the different levels of fear and comfort they felt while moving through the city. The color red was applied for high levels of fear, green for areas of comfort, and orange for areas in-between the two. (1998:310) Applying this method to my own research, I printed black and white-Boston-maps, with symbols marking out the different subway stops and labels distinguishing each district from the other. Similarly to Matei and Rokeach, I asked my participants to mark out areas on the map in red or green, but lacked an orange pen and instead asked participants to mark areas ‘somewhat, but not completely comfortable,’ in blue. I also asked my participants to accompany their map with an informal interview, in which they had to – in as much detail as they were comfortable with – explain their choice of coloring to me. These informal interviews were recorded in real-time by bullet points, and later in voice recording, after I had left the subject and interview area. All interviews were conducted during the daytime and were carried out in the areas of Central and Kendall in Cambridge, and Back Bay in Boston, MA.
In my sample, I wanted an equal division of men and women and an equal division of white people and people of color. This was desired in order to compare and contrast my results within the two groups. In order to extract these factors as defining, I decided to sample only young adults (20-30 years old) having lived in Boston for at least four years. Who I approached in turn measured up to this standard, as well as who looked like they were in a leisurely setting. I approached 17 people that were eligible to participate, but got rejected by more than half, and ended up with six interviews and their accompanying maps. All participants ranged from 20 to 30 years of age, with an equal division of Caucasians and people of color (three and three, respectively.) Of the six interviews, three of the subjects were women, two were men, and one identified as non-binary. Since I selected my participants based on the two comparative groups of gender and race, I have also chosen to analyze my data in regards to these two aspects. In analyzing my data, I wanted to answer questions such as: how do different genders perceive the city differently, and how much does race impact your thoughts and feelings towards your surroundings, as well as: what physical components have the ability to make a city more fearful, and how do these differ depending on gender and race?
Starting with the aspect of gender, I found a big discrepancy in answers received from all gender groups (male/female/non-binary). Most notably, all three women (Appendix B, E, and F) and the non-binary person (Appendix A), marked several spots in red, whereas the male subjects (Appendix C and D) marked significantly fewer. When asked about their decisions, all non-male subjects attributed at least some of their red markings to areas where they had previously experienced sexual harassment by men, with examples including fondling, cat-calling, and being followed. (See Appendix A, B, E, and F) All non-male subjects experienced another degree of fear during night time, with many of them mentioning that empty streets and bad lightning made them feel unsafe. (See Appendix B, E, and F) Areas also frequently avoided were areas of little public activity during night time – places far away from the subway lines, as well as residential areas. (See Appendix A, B, and F) In contrast, my male subjects felt much more confident in the city. Subject D even went as far as to start his map by saying that he felt safe in all of Boston, and proceeded to circle the districts around the Charles River with great determination. When encountering areas such as Dorchester, Jamaica Plain, and Mattapan, however, he became more hesitant, but proceeded to say that people fearing those areas were “just prejudiced.” (See Appendix D) When asked to explain his statement, the subject revealed that he grew up with his parents’ view of the urban core as a place of danger, dirt, and delinquents. As he had moved out he had explored many of Boston’s different districts alone. “Urban cores change a lot,” he mansplained to me while handing back his all-green map, “they’re not what people think they are – and they’re nothing like what my parents kept telling me to stay away from when I grew up.” (See Appendix D)
Similarly, the comparison of race within my sample gave some interesting results. A general trend was that the three people of color (A, C, and F), regardless of gender, in general, marked more areas in red than their white counterparts (B, D, and E). What is also notable is what areas they marked in red. For example, subject A identified as Latinx and crossed out the Financial District and Back Bay, and put bright red stars on the Logan International Airport and the police station in Jamaica Plain. The feeling of fear surfacing around the airport and the police station was attributed to a feeling of always being aggressively interrogated for no reason, whereas the big cross out of the Financial District and Back Bay was due to the discomfort of being in a business surrounding where “they’re all white, rich, and business casual – and I’m not.” (See Appendix A) Similarly, the red markings by subject C, a Nepali, showed some discomfort around white peoples, most obvious when the subject marked out Cambridge in green, explained that there weren’t a lot of white nor black people in the area, but rather lots of Latinx and Asians, which made him feel safe. Contrastingly, subject D, a white man, marked all areas in green, and subject E, a white woman, did the same – with the exception of the area of Dorchester, which she proceeded to mark in blue due to her friend’s recommendations. (See Appendix E)
My research suggests that we experience the city of Boston very differently depending on what gender and race we identify as, and that this, in turn, biases our experience of the city. For example, a woman will, in general, because of their gender, tend to avoid certain areas due to fear of being physically hurt or sexually harassed. These areas, however, seem to correspond to certain physical elements of the city, with dark areas or areas not easily accessible by public transport (such as the T) being the ones most frequently avoided. Similarly, the spatial fear of a person of color seems to be a mixture of both Lynch and Milgram’s proposals, with people of color expressing fear of being unjustly interrogated and surveilled, as well as scorned at; a feeling triggered by the physical elements of the wealthy district, such as newly constructed skyscrapers and logos of banks and other finance companies. In contrast, my findings show that men express less fear of navigating through the city and inhabit no fear of sexual harassment. The areas avoided, if any, are areas described as “sketchy” due to little commercial activity. The discrepancy between a person of color and a white person’s experience of the city is similar; a white person will express no fear of being interrogated or surveilled and will express more confidence in areas that they have biases about, such as the ethnic neighborhoods of Dorchester and Roxbury. The city is thus, much like Milgram proposed, a social fact, having the power to affect our subconscious and our relation to the spatial environment; but also, as Lynch proposed, a space of potential legibility which subconsciously guides us through the level of emotional comfort it is able to provide.
However, the research I have conducted is incredibly biased due to my small sample, and will inherently be biased by my own views of the city as a woman of color, due to who I felt comfortable approaching, and who in turn felt comfortable participating. Also noteworthy is that subject E was the only one to mark anything in blue, even though I told all my subjects to mark areas they deem to be inbetween safe and unsafe in blue. This could be blue, unlike orange or yellow, is not associated with being in-between, but is instead regarded as quite neutral – or maybe I wasn’t clear enough in my instructions. Another potential bias was the note-taking and voice recordings in which I recalled my interviews. Since most of my interviews were a flowing conversation, it was hard to take exact notes of what the subject was saying, and I will have inevitably only jotted down the things I myself found the most interesting or noteworthy. It would also be preferable to collect a bigger sample of data and to collaborate with researchers of other demographics in order to eliminate bias and get a more objective result.
References
Ball-Rokeach, Sandra., and Sorin Adam Matei. 2005. “Watts, the 1965 Los Angeles Riots, and the Communicative Construction of the Fear Epicenter of Los Angeles.” Communication Monographs 72(3):301-323.
Lynch, Kevin. 1960. The Image of the City. Cambridge, MA: The MIT Press.
Milgram, Stanley. 1984. “Cities as Social Representations.” Pp. 289-309 in Social Representations, edited by Robert M. Farr, and Serge Moscovici. Cambridge: Cambridge University Press.