Anneli Xie
Profs. Alice Friedman & Martha McNamara
ARTH 266: New Perspectives on the Global City
2018/12/13
Profs. Alice Friedman & Martha McNamara
ARTH 266: New Perspectives on the Global City
2018/12/13
Copenhagenizing Boston: Creating a Bike-Friendly Environment in a Car-Centric System
On November 9, 2018, 24-year old
Meng Jin suffered a fatal crash on his bicycle in the intersection of Museum
Way and Monsignor O’Brien Highway, in Boston, MA. Colliding with a dump truck
making the same right turn as him, it was only a matter of seconds before Jin
was on the ground, run over by the wheels of the large vehicle.(The Boston Globe 2018:1) Two
years prior to his death, Dr. Anita Kurmann, 38 years at the time, suffered the
same fate, crushed under the rear wheels of a turning truck. (The Boston Globe 2018:2) While Jin’s case hasn’t yet completed investigation, the killer of Kurmann
suffered no legal consequences. Since both cases are similar, however, it is likely no charges will be filed
for Jin’s prosecutor either. Instead, moving through the city of Boston, ghost
bikes can be seen everywhere. (Fig. 1) Painted completely in white, these
bikes are silent memorials put up for the victims of fatal bicycle collisions
at the site of their death. Often, these are big intersections populated by
heavy vehicular traffic, such as the intersection between Massachusetts Ave.
and Beacon Street, where 14 bike-car collisions were recorded by Boston’s
Emergency Medical Services during the years of 2009-2012, and where Dr. Kurmann’s
ghost bike was inaugurated in 2015. (Lopez et al 2014) In a hostile environment like this, where
fatal bike collisions are not uncommon – and rarely consequential for
anyone else other than the casualty – it is no surprise that the modal share of
bicycles in the city of Boston is only 2.4%. (Walsh 2017, 36)
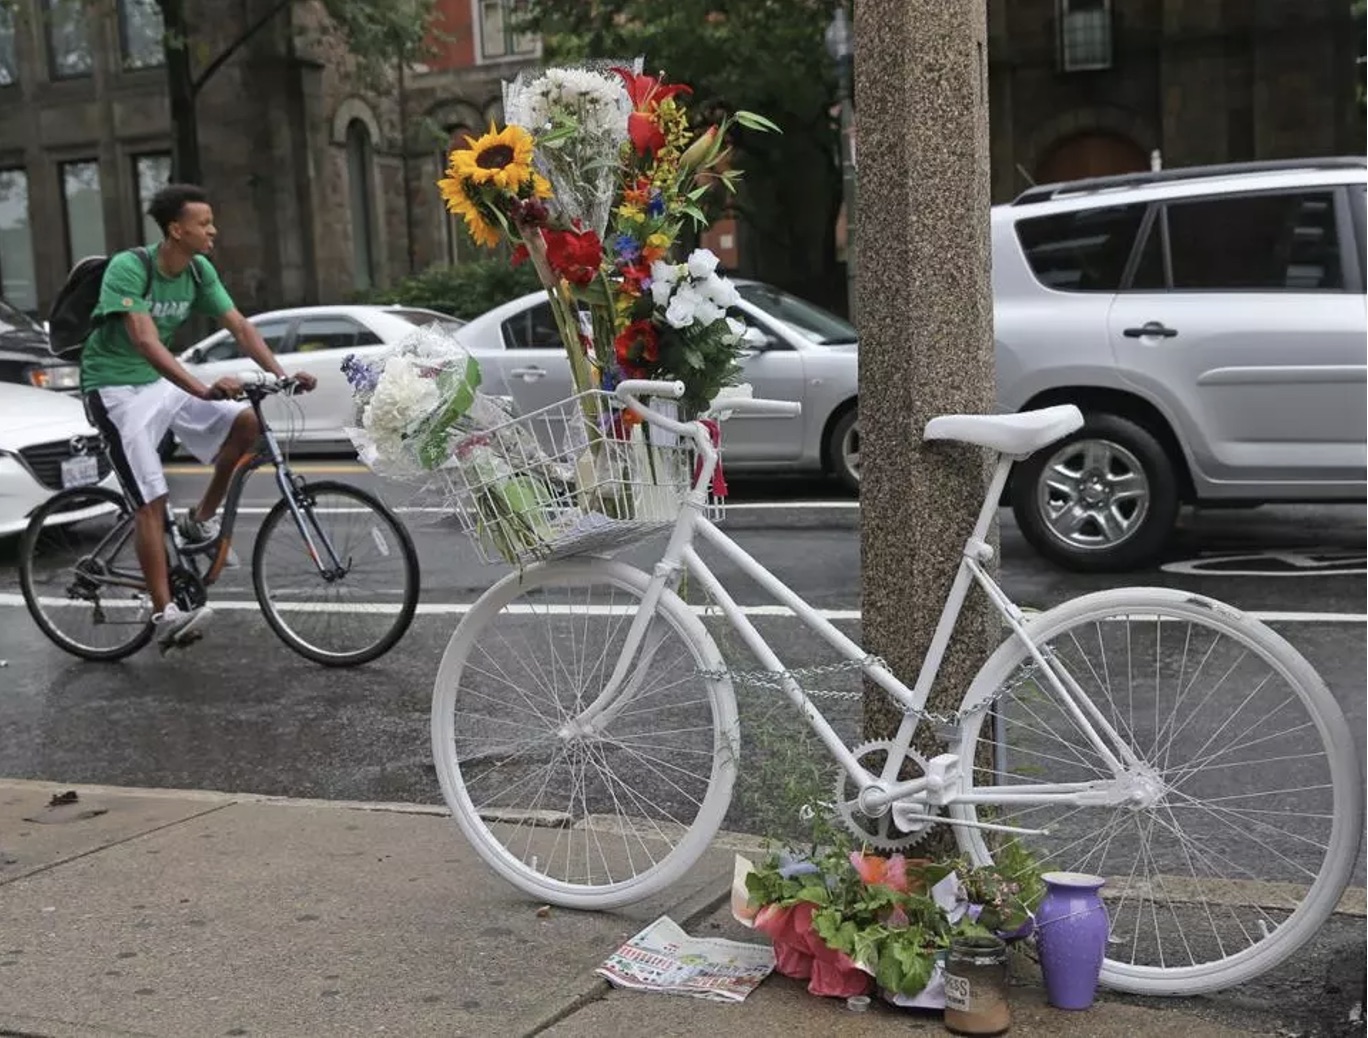
Fig. 1. Anita Kurmann’s ghost bike, installed in the intersection of Beacon Street and Massachusetts Ave. in Boston, MA).
Ryan, David L. Digital image. “Group blames truck driver for fatal 2015 bike crash; police say prosecution’s not warranted.”
January 23, 2018. Accessed December 13, 2018.
Enter Copenhagen, home to a population where 62% choose to commute to work or school by bike and where an average of 1.4 million kilometers are cycled on an ordinary weekday. Copenhagen’s extensive bicycle network has since its expansion in the late 1900s grown to become a defining part of the city, transforming its inhabitants into happier, safer, and more sustainable people, as well as more efficient commuters. The bicycle is a versatile tool that has been prioritized in its urban cityscape to function as a safe and efficient mode of transportation, as well as a unifier of peoples; and although Copenhagen is often regarded as a “city of cyclists,” (Kabell 2018) it has not always been this way. In the mid-1900s, Copenhagen, much like many other cities in Europe, followed the American vision of modernism, and a car-centric plan á la Robert Moses was spearheaded by the government. (Colville-Andersen 2018, 64-67) Large buildings were erected and highways cutting through the core of the city were planned. More and more space was given to the automobile, and in the 1970s, the modal share of bicycles fell to an all-time low of 10%. Luckily, left with little funds after World War II and struck by two oil crises in the 1970s, Denmark was never able to carry these plans out. It wasn’t until 1982, however, that Copenhagen’s first bike lane was inaugurated. (Colville-Andersen 2018, 66-68) Yet today, only four centuries later, life in Copenhagen is defined by the bicycle; the reason behind its success found not in a long history of biking, but rather in a well-designed and intuitive bicycle infrastructure that has seduced its people by simply being built and continuously prioritized.
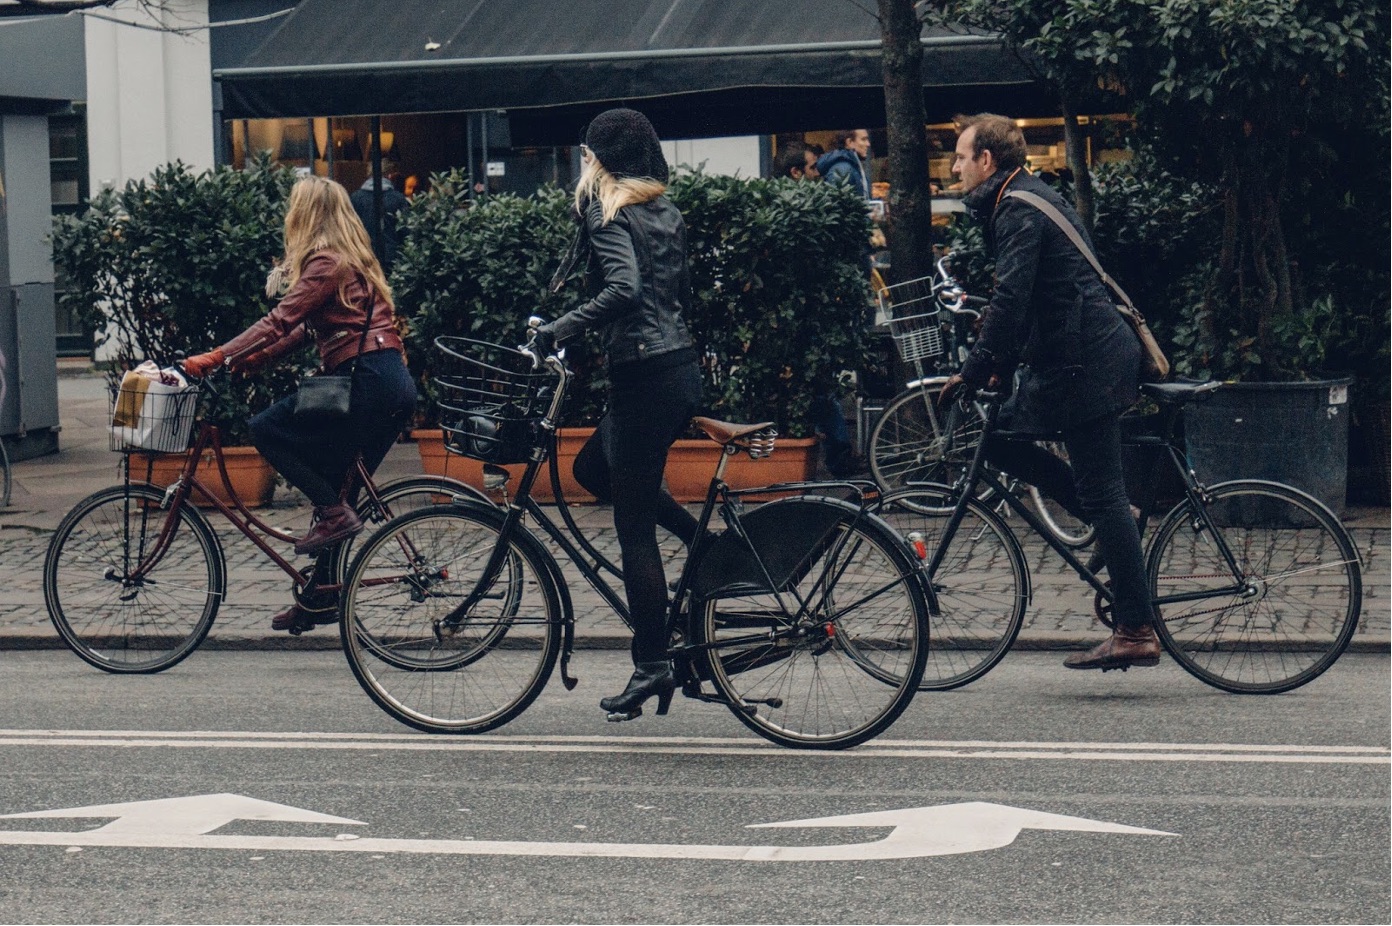
Fig. 2. Usual Copenhagen cyclist attire: dark or muted colors – and no bike helmet!
Kraujina, Zane. Digital image. “Confidence on a bike.” November 21, 2016. Accessed December 13, 2018. http://www.copenhagencyclechic.com/2016/11/confidence-on-bike.html.
Boston and Copenhagen share some defining characteristics, even though comparing the two may seem like a far stretch. Boston is the capital of Massachusetts and Copenhagen is the capital of Denmark, both host around 600,000 inhabitants, and Copenhagen used to be as car-centric as Boston is today. How come the two cities differ so much in their modes of transportation, with 62% of Copenhageners commuting by bike, and only 2.4% of Bostonians doing the same? How can bicycle infrastructure in Boston be re-designed to seduce their citizens by design, much like Copenhageners have been seduced by theirs; and why would this be desirable? This paper will explore the possibility of re-designing the city of Boston into a more bike-friendly environment by looking to Copenhagen as a role model for well-functioning infrastructure. It will also discuss the consequences of these implementations through a lens of safety, convenience, and efficiency, to argue that mimicking some design features of Copenhagen’s bicycle infrastructure has the ability to turn Boston into a more livable, breathable, and accessible city.
I. SAFETY & SPACE THROUGH MACRO DESIGN
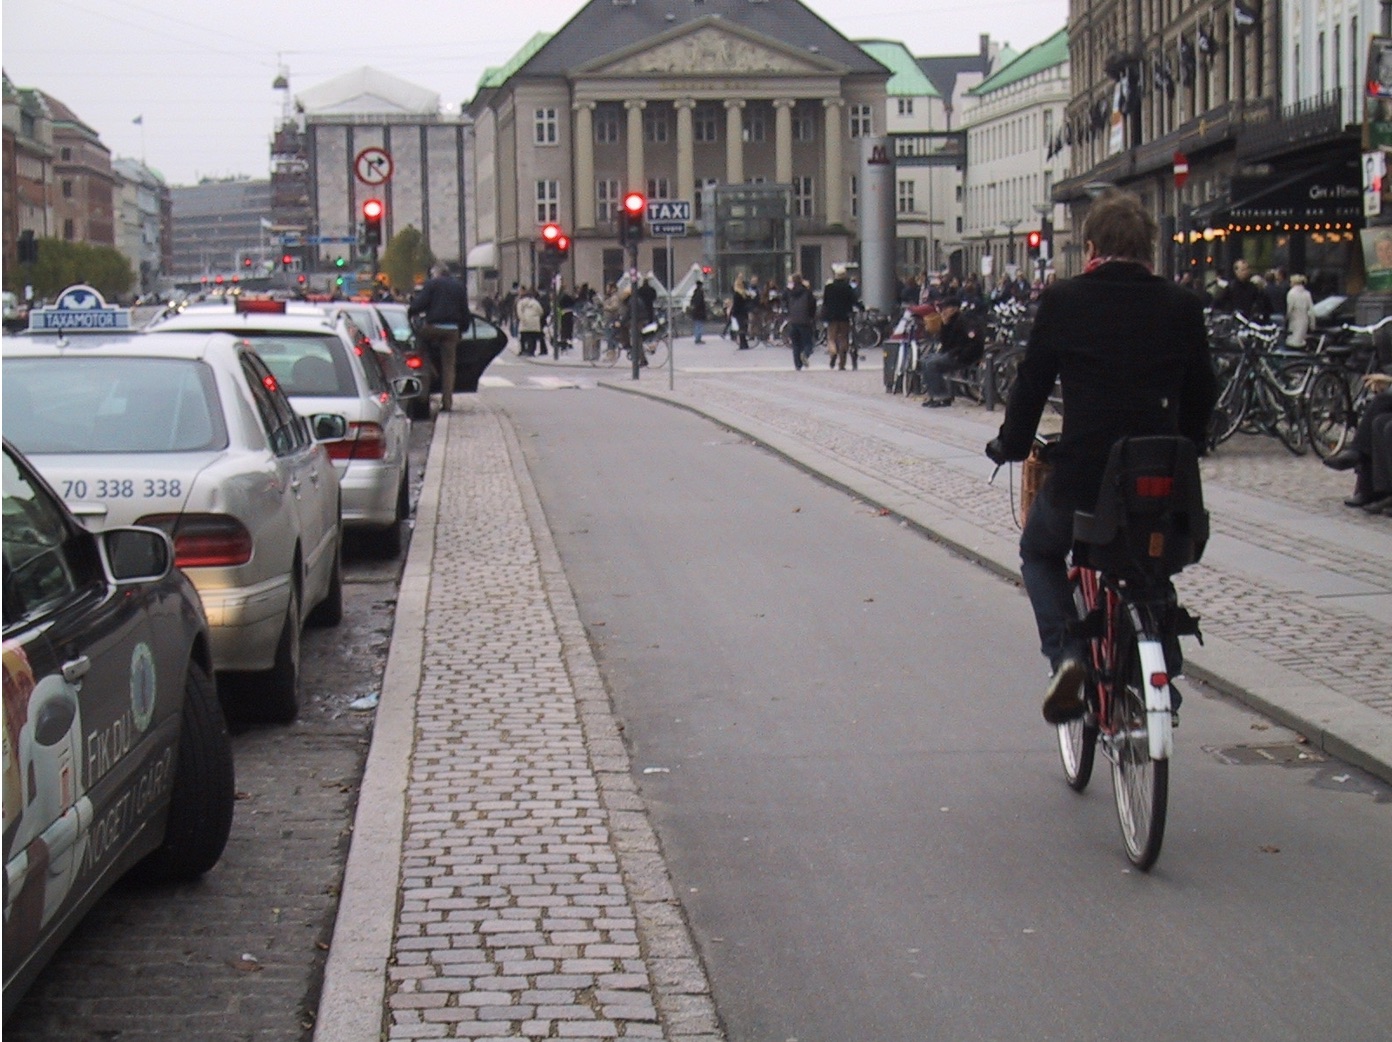
Fig. 3. A curb-segregated bike lane in Copenhagen. Notice the distance between the opened taxi door and the bike lane – designed for cyclists to not be doored. Gemzøe, Lars. Digital image. “Cycle tracks that come to you as you go.” November 15, 2010. Accessed December 13, 2018. http://www.cycling-embassy.dk/2010/11/15/cycle-tracks-that-come-to-you-as-you-go/.
A bike-friendly space has to be a safe space. In 2017, when Boston experienced 380 bicycle collisions Copenhagen suffered 59 less: 321. (City of Boston 2018) (Statistics Denmark 2018) A difference of 59 might not seem so serious; but when considering the average number of cyclists in the two cities, 59 makes a big difference in regards to safety and the feeling of being safe. In 2017, an average of 40,000 bike trips were made in Boston every day. (Walsh 2018) In Copenhagen, that number was exceeded on just one of the city’s many bridges, Dronning Louise’s Bridge, where over 48,000 bikes crossed daily. (Kabell 2018) Even though there are significantly more cyclists in Copenhagen, a Bostonian is 87% more likely to be seriously injured in a bicycle accident than if she were to take the same ride in Copenhagen. Numbers don’t lie: biking in Boston can prove a stressful and anxiety-inducing experience. In 2017, only 48% of cycling Bostonians recorded feeling safe while riding a bicycle, (Walsh 2018) while their Copenhagen counterparts recorded 76%. (Danish Cycling Embassy 2017) In “The Urban Cycling Survival Guide,” author Yvonne Bambrick suggests several ‘survival strategies’ for cycling in the city; including: wearing bright colors for visibility, not wearing headphones, and biking only “when it’s safe, and not when you have the right of way.” (Bambrick 2015, 41-53) However, if you take a closer look on the cyclists of Copenhagen, you’ll notice several of them looking at their phone, listening to music, and being dressed in muted colors. (Fig. 2) Yet, they have survived urban cycling – and have even managed to feel safe in the meantime. The reason for this is simple. While city traffic is fluid, ever-changing, and often fast and unpredictable – and while all of Bambrick’s suggestions are true for road safety – it shouldn’t be up to the cyclist alone to make sure she experiences a safe and pleasant ride through the city. Instead, this task has to be delegated to city planners, policy makers, and engineers: the people who make our streets – much like it has been in Copenhagen.
The reason biking feels so safe in Copenhagen is because it is. The city has been designed to accommodate and prioritize bicyclists, with private investments and the Danish government having invested over two billion DKK since 2004 to improve cycling in the city. (Kabell 2016) This has led to 416 km of bike lanes, where 375 km (90%) is curb-segregated, meaning a safe space carved out solely for bicyclists, separated from both vehicular and pedestrian traffic by a 5-9 cm tall curb on both sides of the lane. (Fig. 3) (Colville-Andersen 2018, 180) The rule of thumb when deciding what bike lane is most appropriate to enforce on a certain part in Copenhagen, is to look at the speed of the vehicular traffic on the same road. Where cars are allowed to drive 10-30 km/h, bicycles share the road; where cars are allowed to drive 40 km/h, sharrows (marked shared lanes) (Fig. 4) are sufficient; where cars go at 50-60 km/h, a curb should be employed; and where cars go over 60 km/h, bike lanes need to be fully separated in order to create a safe and pleasant biking experience. The width of lanes is also significant, with 2.3 m (7.5 feet) being the minimum and some lanes expanding to 4 m to accommodate for busy traffic,meaning cyclists can safely overtake each other without pushing each other off the road. (Colville-Andersen 2018, 180) In contrast, Boston hosts 169 km of bike lanes, but only 9.6 km (5%) are protected, meaning 95% are sharrows running alongside moving vehicular traffic — and where there aren’t dedicated bike lanes, bicyclists simply have to share the vehicular road to get around. (Walsh 2018) On top of this, the minimum width is 1.2 m – almost half of the minimum width for bike lanes in Copenhagen. (Boston Transportation Department 2013) Whereas the default speed limit for the city of Boston is 25 mph (40 km/h,) it has been found that on average, more than 80% of drivers go past the speed limit by at least 5 mph (8 km/h.). (Massachusetts Institute of Technology 2018) Following Copenhagen standards, this calls for a curb-segregated bike lane – something not yet introduced in the city of Boston. Instead, narrow sharrows are the best bicyclists can get – an incredibly dangerous alternative in comparison.

Curb-segregated bicycle lanes might seem expensive, but they are extremely cheap in comparison to the cost of building and maintaining roads for cars. In Copenhagen, the city has found that every new kilometer cycled in Copenhagen is equivalent to a 1.34 DKK gain to society in saved health care costs, whereas there is a loss of 5.64 DKK for every km traveled in a car during rush hour. (Danish Cycling Embassy 2017) A reallocation of funds in Boston’s city budget would enable safer bicycle infrastructure while simultaneously making the return on investment quick. If a curb-segregation is not possible to implement, there are other solutions (although they should only been treated as temporary ones): movable curb-separations created out of plastic or concrete, bollards or buoys – or any other visual cue that can separate a bike lane from traffic, (Fig. 5) although these are easy to knock or run over. Whereas fixes such as these are not ideal nor a long-term solution, they are a cheap improvement that have the ability to quickly improve the safety of bicyclists – and thus, save lives.
II. CONVENIENCE & EFFICIENCY THROUGH MICRO DESIGN
Fig. 6. A Copenhagen cyclist leaning on to a handrail. The footrail is the lower section that can also be seen in this photo.
Colville-Andersen, Mikael. 2017. In Copenhagenize: The Definitive Guide to Global Bicycle Urbanism. (Washington: Island Press, 2018.) 216.
People won’t choose to bike solely because it is safe; it also has to be delightful and intuitive. In Copenhagen, the biggest reason people bike is because it is fast and easy. When a safe and functional bicycle network has been implemented, it is time to start thinking about how cycling can be made more convenient and efficient through micro design. One example of this is “the Green Wave.” Implemented in 2004, the Green Wave is a 2.2 km stretch of coordinated traffic lights implemented specifically for bicycles, meaning that if you are biking with an average speed of 20km/h on the Green Wave, you won’t have to stop at a single intersection. This idea, taken from a long history of engineering improving traffic flow for cars, has been hugely successful; cyclists experience an average of 70% fewer stops and a 10% decrease in total travel time. (Colville-Andersen 2018, 239) The hand-and foot rails (Fig. 6), too, are designed specifically for improving the cycling flow. A design feature installed in traffic light intersections to be used by cyclists heading straight on wait, these rails are a small and discrete detail in the urban cityscape but make a big difference to cyclists passing through the city. Not having to get off your bike at an intersection by placing a hand or a foot on a rail for balance saves cyclists a few extra seconds and has the ability to make a bike ride just that much more pleasant.
Another minor design feature making a huge difference is the design of Scandinavian bicycles. Whereas features such as kickstands, locks, lights, bells, fenders, baskets, and rear racks, are seen as “add-ons” in North America, they are the default for Scandinavian bicycles. (Bambrick 2015, 26-35) While all minor design features, these make the bicycle infinitely more user-friendly and easy to handle and ride. Having a kickstand means being able to park your bike anywhere; bells can help get the attention of pedestrians not aware of your presence; fenders help keep your clothes clean when riding in wet or muddy weather; baskets and rear racks can easen physical strain as they provide storage for backpacks, grocery bags, and other heavy things – but out of all of these, the retractable ring lock is the most powerful feature.

Fig. 7 and 8. A bollard rack in Boston and a Copenhagen style bike parking: a rack with rings.
Left (fig. 7):Boston Transportation Department. “Park your bike.” Accessed December 13, 2018. https://www.boston.gov/departments/boston-bikes/park-your-bike. Right (fig. 8): Colville-Andersen, Mikael. Digital image. “New Bike Racks at Copenhagenize Design Co.” Accessed December 13, 2018. https://www.flickr.com/photos/16nine/13949567467.
Whereas cyclists in most countries outside of Europe utilize cable locks or U-locks for their bikes, they are rarely seen in cycle cities such as Copenhagen. Whereas both cable- and U-locks are bulky and inconvenient to carry around (especially with the lack of a front basket and/or rear rack), a ring lock is attached to the top of the back wheel, securing it by a steel bolt through the spokes that prevent motion. Whereas a ring lock can’t be tied to a physical structure like other locks can, it – in contrast to a cable- or U-lock that can be cut open on the spot – is a small feature, making it harder for thieves to cut without destroying the bike. This means they have to carry a locked bike – risking looking suspicious and getting caught – making a ring lock a safer feature than it seems. Furthermore, locks that don’t require being tied to a physical structure have the ability to make bike parking more convenient, efficient, and space-saving in urban cityscapes. The Bollard rack – the standard bike rack in Boston – is a short vertical post with a circle to which bikes can be secured. (Fig. 7) While a Bollard rack provides a leaning structure for a bicycle, it can host two locked bikes at most; and measuring 190 x 90 cm, a Bollard rack takes up a substantial amount of space when used. (Boston Transportation Department 2016) In Copenhagen, the standard bike parking is a rack with rings, securing the front wheel and preventing the bicycle from falling over. (Fig. 8) A rack of this sort, fitted for five bicycles, measures only 140 x 32 cm, taking up substantially less space than its American counterpart. As a result, the city of Copenhagen has managed to fit 180,000 publicly available parking spots in the city, (Cycling Embassy of Denmark 2018) in comparison to Boston’s mere 3000 racks, recorded as of 2013. (Teitell 2018) In a city such as Boston, where space is limited, it’d be highly beneficial to equip bicycles with a ring lock, kickstands, and install Copenhagen-standard bike racks, to get more people biking. Being able to park exactly where you need to go without fearing that your bike is going to get stolen is currently a luxury for Bostonians, although in a bike-friendly city, that should be expected; and whereas bicycle parking is often left unnoticed to those who are not cyclists – to those who are, they make a big difference.
III. IMPROVING THE PUBLIC SPHERE & HUMAN INTERACTION
Good bicycle infrastructure can better human behavior and promote human interaction, which can make a city more livable, and its citizens happier. In “Happy City,” Charles Montgomery showcases empirical evidence that spending hours commuting by car decreases life satisfaction and that active commuting – such as walking or biking – improves psychological well-being. (Montgomery 2013, 228) The equation is quite simple: re-allocating street space from cars to bicycles equals more bikes and fewer cars, which equals less pollution, less noise, and a safer public space – something that sadly hasn’t been well-received in the car-centric continent of North America. In 2010, Toronto council member Rob Ford even went so far as to say that “roads are built for buses, cars, and trucks, not for people on bikes.” (Sadik-Khan 2016, 145) Contrary to Ford’s belief, however, cars have had a “dramatic worsening of conditions for pedestrians and bicycle traffic” (Gehl 2010, 92) around the world, taking their toll on the lively public life and the safety in public places, a concern American activist and urbanist legend Jane Jacobs brought up already in the mid 1900s. In order to keep a street safe, Jacobs argued, it has to have mixed functions that entices people to stay in the space, providing “eyes on the street.” (Jacobs 1961, 54) Eyes on the street don’t exist when the majority of the street is filled by cars, in which you are completely anonymous and unable to experience the spontaneous human interaction that inevitably happens otherwise – looking people in the eye, having to wait next to them to cross an intersection and maybe exchanging a word or two, or if you are a bicyclist, stretching your arm out to signal that you are turning. When driving, there is a certain anonymity and social exclusion; the automobile is a private entity after all. Whereas motorists can commute ‘unbothered’ – walking out of their home into their car, driving to work and entering an office – being a cyclist or pedestrian contributes to a city feeling more human by requiring a close connection to the urban cityscape. It is exactly this that in turn provides eyes on the street, making a street feel safer and more livable by Jacobs’ measures.
Applying this to Boston, where 46% commute by car – and where 39% of those are solo drivers (Walsh 2018) – seems like a challenge; but it doesn’t have to be. In 2013, Danish architect Jan Gehl noted: “if you make more road space, you get more cars. If you make more bike lanes, you get more bikes. If you make more space for people, you get more people and of course then you get public life.” (Gehl 2010) If bicycle infrastructure can be improved and expanded in Boston, more people will bike, which will in turn boost public life in the city. The hardest part is of course doing so. Sadly, as cars flourished in numbers and popularity in the mid 1900s, the bicycle was pushed aside to be seen less as a tool for transportation and more of a sport, making it inaccessible to many by culture and design. In the United States today, biking is heavily divided across both age and gender: with young men being the most prominent riders in the nation. (Florida 2017) However, by making the bicycle accessible to more people, by both improved infrastructure and bicycle design, but also education and advocacy, Boston has the potential to see a shift in culture and perceived attitudes towards the bicycle. Because the truth is, the bicycle is really a tool beneficial for everyone to use – and one that should be more readily accessible to most. With a safe infrastructure in place, it is not strange that most Danish children learn how to bike before the age of six, nor that the division between male and female bicyclists are almost equal (with women biking a few more trips on average.) (Ministry of Foreign Affairs Denmark 2018) By implementing some of the design features that have previously been discussed in this paper, Boston could achieve the same.
V. BOSTON AS A LIVABLE, BREATHABLE, & ACCESSIBLE CITY
By acknowledging the bicycle as a tool for both economic, socioeconomic, and environmental gain, prioritizing bicycle infrastructure in the future development of the city of Boston has the potential to transform a car-centric system into a safer and more livable city by simply being implemented. In an ever-changing and rapidly growing cityscape, this is something Boston ought to aim for to make the city more accessible to its inhabitants. By constructing wide curb-segregated bike lanes and by implementing transitory curb structures where this is not possible, Boston can build a strong foundation for new cyclists to thrive in safety and comfort. By changing the standards of bicycle accessories, locks, as well as re-thinking the design of bicycle parking, Boston can facilitate the bike ride for cyclists already existing in the city, making them feel recognized and incentivized to keep biking. By legitimizing bicycles and putting their presence on the streets, Boston can experience an increase in happiness and public interaction, adding a much-needed human touch to a currently hostile environment. All of this while saving money and decreasing both pollution and social exclusion.
Design has the ability to endlessly shape and govern over human decision making – whether we are conscious of it or not. Design defines people, and people define cities. If we want a livable, breathable, and accessible city – we need a city design that allows for its citizens to be sustainable, happy, and equal. For this, bicycles are just one of many solutions – but nevertheless a very important one, in which changes on both a macro and micro level have the ability to make a big difference.
Andersen, Travis. “Cyclist killed is identified as BU graduate student.” The Boston Globe, November 9, 2018. https://www.bostonglobe.com/metro/2018/11/09/pedestrian-hit-truck-seriously-hurt-near
museum-science//story.html target="_blank">story.html
Bambrick, Yvonne. The Urban Cycling Survival Guide. Toronto: ECW Press, 2015.
Boston Transportation Department. “Minimum Lane Widths in the City of Boston.” Last modified September 19, 2013. https://issuu.com/bostontransportationdepartment/docs/3_5.
Boston Transportation Department. Bike Parking. Boston: City of Boston, 2016. https://www.boston.gov/sites/default/files/document-file-08-2016/rack_installation_guidelines.pdf
Colville-Andersen, Mikael. Copenhagenize: The Definitive Guide to Global Bicycle Urbanism.
Washington: Island Press, 2018.
Cycling Embassy of Denmark. “First Every Priority Plan for Bicycle Parking in Copenhagen.” Last modified March 12, 2018. http://www.cycling-embassy.dk/2018/03/12/first-ever-priority-plan-bicycle-parking-copenhagen.
Cycling Embassy of Denmark. Copenhagen City of Cyclists – facts and figures 2017. Copenhagen: City of Copenhagen. http://www.cycling-embassy.dk/wp-content/uploads/2017/07/Velo-city_handout.pdf.
Department of Innovation and Technology. Vision Zero Fatality Records. V1. July 23, 2018. Distributed by the City of Boston, https://data.boston.gov/dataset/vision-zero-fatality-records.
Ellement, John R.“What the police report shows on the tragic crash in Back Bay that left bicyclist dead.” The Boston Globe, February 1, 2018.
https://www.bostonglobe.com/metro/2018/02/01/what-police-report-shows-tragic-crash-back-bay-that-left-bicyclist-dead/story.html
Florida, Richard. “Mapping America’s Bike Commuters.” Published May 19, 2017. https://www.citylab.com/transportation/2017/05/mapping-americas-bike-commuters/52923/.
Gehl, Jan. Cities for People. Washington: Island Press, 2010.
Jacobs, Jane. The Death and Life of Great American Cities. New York: Vintage Books, 1961.
Kabell, Morten. Copenhagen City of Cyclists: The Bicycle Account 2016. Copenhagen: Cycling Embassy of Denmark, 2018.
http://www.cycling-embassy.dk/wp-content/uploads/2018/02/CPH-Bicycle-Account-2016.pdf.
Lopez, Dahianna., Maria Cheevers, Pete Stidman, Daniel O’Brien. Bicycle Collisions in Boston, MA (2009-2012). V2. July 24, 2014. distributed by Harvard Dataverse. https://doi.org/10.7910/DVN/24713.
Ministry of Foreign Affairs of Denmark. “A nation of cyclists. Accessed December 12, 2018. https://denmark.dk/people-and-culture/biking.
Montgomery, Charles. Happy City. Toronto: DoubleDay Canada, 2013.
National Motorist Association and Massachusetts Institute of Technology. “How fast is traffic?” Accessed December 12, 2018. http://www.mit.edu/~jfc/NMA/limits.html.
Sadik-Khan, Janette, and Seth Solomonow. Streetfight. New York: Penguin Books, 2016.
Statistics Denmark. “Injured and killed in road traffic accidents by casualty, region and time.” Accessed December 11, 2018. http://www.statbank.dk/statbank5a/default.asp?w=1440.
Statistics Denmark. “Population in Denmark, Q4 2018” Accessed December 11, 2018,
https://www.dst.dk/en/Statistik/emner/befolkning-og-valg/befolkning-og-befolkningsfromskrivning/folketal.
Teitell, Beth. “Like motorists, bike riders scramble for places.” The Boston Globe, July 7, 2018.
https://www.bostonglobe.com/lifestyle/health-wellness/2013/07/07/new-kind-problem-where-park-your-bike/830w8eN7YVDZDublGfwVhL/story.html.
US Census Bureau. “QuickFacts: Boston City, Massachusetts.” Accessed December 11, 2018. https://www.census.gov/quickfacts/bostoncitymassachusetts.
Walsh, Martin J. 2017 Boston Bicycle Counts: Measuring how many people ride bikes in the
City. Boston: City of Boston Transportation Department. https://www.boston.gov/sites/default/files/document-file-02-2018/2017_boston_bike_counts_report.pdf
Walsh, Martin J. Go Boston 2030: Vision and Action Plan. Boston: Boston Transportation
Department, 2017. https://www.boston.gov/sites/default/files/document-file-03-2017/go_boston_2030_-_full_report_to_view.pdf.
Fig. 1. Anita Kurmann’s ghost bike, installed in the intersection of Beacon Street and Massachusetts Ave. in Boston, MA).
Ryan, David L. Digital image. “Group blames truck driver for fatal 2015 bike crash; police say prosecution’s not warranted.”
January 23, 2018. Accessed December 13, 2018.
Enter Copenhagen, home to a population where 62% choose to commute to work or school by bike and where an average of 1.4 million kilometers are cycled on an ordinary weekday. Copenhagen’s extensive bicycle network has since its expansion in the late 1900s grown to become a defining part of the city, transforming its inhabitants into happier, safer, and more sustainable people, as well as more efficient commuters. The bicycle is a versatile tool that has been prioritized in its urban cityscape to function as a safe and efficient mode of transportation, as well as a unifier of peoples; and although Copenhagen is often regarded as a “city of cyclists,” (Kabell 2018) it has not always been this way. In the mid-1900s, Copenhagen, much like many other cities in Europe, followed the American vision of modernism, and a car-centric plan á la Robert Moses was spearheaded by the government. (Colville-Andersen 2018, 64-67) Large buildings were erected and highways cutting through the core of the city were planned. More and more space was given to the automobile, and in the 1970s, the modal share of bicycles fell to an all-time low of 10%. Luckily, left with little funds after World War II and struck by two oil crises in the 1970s, Denmark was never able to carry these plans out. It wasn’t until 1982, however, that Copenhagen’s first bike lane was inaugurated. (Colville-Andersen 2018, 66-68) Yet today, only four centuries later, life in Copenhagen is defined by the bicycle; the reason behind its success found not in a long history of biking, but rather in a well-designed and intuitive bicycle infrastructure that has seduced its people by simply being built and continuously prioritized.
Fig. 2. Usual Copenhagen cyclist attire: dark or muted colors – and no bike helmet!
Kraujina, Zane. Digital image. “Confidence on a bike.” November 21, 2016. Accessed December 13, 2018. http://www.copenhagencyclechic.com/2016/11/confidence-on-bike.html.
Boston and Copenhagen share some defining characteristics, even though comparing the two may seem like a far stretch. Boston is the capital of Massachusetts and Copenhagen is the capital of Denmark, both host around 600,000 inhabitants, and Copenhagen used to be as car-centric as Boston is today. How come the two cities differ so much in their modes of transportation, with 62% of Copenhageners commuting by bike, and only 2.4% of Bostonians doing the same? How can bicycle infrastructure in Boston be re-designed to seduce their citizens by design, much like Copenhageners have been seduced by theirs; and why would this be desirable? This paper will explore the possibility of re-designing the city of Boston into a more bike-friendly environment by looking to Copenhagen as a role model for well-functioning infrastructure. It will also discuss the consequences of these implementations through a lens of safety, convenience, and efficiency, to argue that mimicking some design features of Copenhagen’s bicycle infrastructure has the ability to turn Boston into a more livable, breathable, and accessible city.
I. SAFETY & SPACE THROUGH MACRO DESIGN
Fig. 3. A curb-segregated bike lane in Copenhagen. Notice the distance between the opened taxi door and the bike lane – designed for cyclists to not be doored. Gemzøe, Lars. Digital image. “Cycle tracks that come to you as you go.” November 15, 2010. Accessed December 13, 2018. http://www.cycling-embassy.dk/2010/11/15/cycle-tracks-that-come-to-you-as-you-go/.
A bike-friendly space has to be a safe space. In 2017, when Boston experienced 380 bicycle collisions Copenhagen suffered 59 less: 321. (City of Boston 2018) (Statistics Denmark 2018) A difference of 59 might not seem so serious; but when considering the average number of cyclists in the two cities, 59 makes a big difference in regards to safety and the feeling of being safe. In 2017, an average of 40,000 bike trips were made in Boston every day. (Walsh 2018) In Copenhagen, that number was exceeded on just one of the city’s many bridges, Dronning Louise’s Bridge, where over 48,000 bikes crossed daily. (Kabell 2018) Even though there are significantly more cyclists in Copenhagen, a Bostonian is 87% more likely to be seriously injured in a bicycle accident than if she were to take the same ride in Copenhagen. Numbers don’t lie: biking in Boston can prove a stressful and anxiety-inducing experience. In 2017, only 48% of cycling Bostonians recorded feeling safe while riding a bicycle, (Walsh 2018) while their Copenhagen counterparts recorded 76%. (Danish Cycling Embassy 2017) In “The Urban Cycling Survival Guide,” author Yvonne Bambrick suggests several ‘survival strategies’ for cycling in the city; including: wearing bright colors for visibility, not wearing headphones, and biking only “when it’s safe, and not when you have the right of way.” (Bambrick 2015, 41-53) However, if you take a closer look on the cyclists of Copenhagen, you’ll notice several of them looking at their phone, listening to music, and being dressed in muted colors. (Fig. 2) Yet, they have survived urban cycling – and have even managed to feel safe in the meantime. The reason for this is simple. While city traffic is fluid, ever-changing, and often fast and unpredictable – and while all of Bambrick’s suggestions are true for road safety – it shouldn’t be up to the cyclist alone to make sure she experiences a safe and pleasant ride through the city. Instead, this task has to be delegated to city planners, policy makers, and engineers: the people who make our streets – much like it has been in Copenhagen.
The reason biking feels so safe in Copenhagen is because it is. The city has been designed to accommodate and prioritize bicyclists, with private investments and the Danish government having invested over two billion DKK since 2004 to improve cycling in the city. (Kabell 2016) This has led to 416 km of bike lanes, where 375 km (90%) is curb-segregated, meaning a safe space carved out solely for bicyclists, separated from both vehicular and pedestrian traffic by a 5-9 cm tall curb on both sides of the lane. (Fig. 3) (Colville-Andersen 2018, 180) The rule of thumb when deciding what bike lane is most appropriate to enforce on a certain part in Copenhagen, is to look at the speed of the vehicular traffic on the same road. Where cars are allowed to drive 10-30 km/h, bicycles share the road; where cars are allowed to drive 40 km/h, sharrows (marked shared lanes) (Fig. 4) are sufficient; where cars go at 50-60 km/h, a curb should be employed; and where cars go over 60 km/h, bike lanes need to be fully separated in order to create a safe and pleasant biking experience. The width of lanes is also significant, with 2.3 m (7.5 feet) being the minimum and some lanes expanding to 4 m to accommodate for busy traffic,meaning cyclists can safely overtake each other without pushing each other off the road. (Colville-Andersen 2018, 180) In contrast, Boston hosts 169 km of bike lanes, but only 9.6 km (5%) are protected, meaning 95% are sharrows running alongside moving vehicular traffic — and where there aren’t dedicated bike lanes, bicyclists simply have to share the vehicular road to get around. (Walsh 2018) On top of this, the minimum width is 1.2 m – almost half of the minimum width for bike lanes in Copenhagen. (Boston Transportation Department 2013) Whereas the default speed limit for the city of Boston is 25 mph (40 km/h,) it has been found that on average, more than 80% of drivers go past the speed limit by at least 5 mph (8 km/h.). (Massachusetts Institute of Technology 2018) Following Copenhagen standards, this calls for a curb-segregated bike lane – something not yet introduced in the city of Boston. Instead, narrow sharrows are the best bicyclists can get – an incredibly dangerous alternative in comparison.
Fig. 4 and 5. Fig. 4 (left): A common sight in Boston: cars occupying a bike sharrow on Columbus Avenue. Boston Biker.
Digital image. “How To Use A Door Zone Bike Lane Part 2: Attack Of The Door Zone!” October 7, 2010. Accessed December 13, 2018.
Fig. 5 (right) Bollards can easily be knocked over and should thus not be considered a permanent solution.
Reliance Foundry. Digital image. “Traffic Bollards.” Accessed December 13, 2018.
Curb-segregated bicycle lanes might seem expensive, but they are extremely cheap in comparison to the cost of building and maintaining roads for cars. In Copenhagen, the city has found that every new kilometer cycled in Copenhagen is equivalent to a 1.34 DKK gain to society in saved health care costs, whereas there is a loss of 5.64 DKK for every km traveled in a car during rush hour. (Danish Cycling Embassy 2017) A reallocation of funds in Boston’s city budget would enable safer bicycle infrastructure while simultaneously making the return on investment quick. If a curb-segregation is not possible to implement, there are other solutions (although they should only been treated as temporary ones): movable curb-separations created out of plastic or concrete, bollards or buoys – or any other visual cue that can separate a bike lane from traffic, (Fig. 5) although these are easy to knock or run over. Whereas fixes such as these are not ideal nor a long-term solution, they are a cheap improvement that have the ability to quickly improve the safety of bicyclists – and thus, save lives.
II. CONVENIENCE & EFFICIENCY THROUGH MICRO DESIGN
Fig. 6. A Copenhagen cyclist leaning on to a handrail. The footrail is the lower section that can also be seen in this photo.
Colville-Andersen, Mikael. 2017. In Copenhagenize: The Definitive Guide to Global Bicycle Urbanism. (Washington: Island Press, 2018.) 216.
People won’t choose to bike solely because it is safe; it also has to be delightful and intuitive. In Copenhagen, the biggest reason people bike is because it is fast and easy. When a safe and functional bicycle network has been implemented, it is time to start thinking about how cycling can be made more convenient and efficient through micro design. One example of this is “the Green Wave.” Implemented in 2004, the Green Wave is a 2.2 km stretch of coordinated traffic lights implemented specifically for bicycles, meaning that if you are biking with an average speed of 20km/h on the Green Wave, you won’t have to stop at a single intersection. This idea, taken from a long history of engineering improving traffic flow for cars, has been hugely successful; cyclists experience an average of 70% fewer stops and a 10% decrease in total travel time. (Colville-Andersen 2018, 239) The hand-and foot rails (Fig. 6), too, are designed specifically for improving the cycling flow. A design feature installed in traffic light intersections to be used by cyclists heading straight on wait, these rails are a small and discrete detail in the urban cityscape but make a big difference to cyclists passing through the city. Not having to get off your bike at an intersection by placing a hand or a foot on a rail for balance saves cyclists a few extra seconds and has the ability to make a bike ride just that much more pleasant.
Another minor design feature making a huge difference is the design of Scandinavian bicycles. Whereas features such as kickstands, locks, lights, bells, fenders, baskets, and rear racks, are seen as “add-ons” in North America, they are the default for Scandinavian bicycles. (Bambrick 2015, 26-35) While all minor design features, these make the bicycle infinitely more user-friendly and easy to handle and ride. Having a kickstand means being able to park your bike anywhere; bells can help get the attention of pedestrians not aware of your presence; fenders help keep your clothes clean when riding in wet or muddy weather; baskets and rear racks can easen physical strain as they provide storage for backpacks, grocery bags, and other heavy things – but out of all of these, the retractable ring lock is the most powerful feature.
Fig. 7 and 8. A bollard rack in Boston and a Copenhagen style bike parking: a rack with rings.
Left (fig. 7):Boston Transportation Department. “Park your bike.” Accessed December 13, 2018. https://www.boston.gov/departments/boston-bikes/park-your-bike. Right (fig. 8): Colville-Andersen, Mikael. Digital image. “New Bike Racks at Copenhagenize Design Co.” Accessed December 13, 2018. https://www.flickr.com/photos/16nine/13949567467.
Whereas cyclists in most countries outside of Europe utilize cable locks or U-locks for their bikes, they are rarely seen in cycle cities such as Copenhagen. Whereas both cable- and U-locks are bulky and inconvenient to carry around (especially with the lack of a front basket and/or rear rack), a ring lock is attached to the top of the back wheel, securing it by a steel bolt through the spokes that prevent motion. Whereas a ring lock can’t be tied to a physical structure like other locks can, it – in contrast to a cable- or U-lock that can be cut open on the spot – is a small feature, making it harder for thieves to cut without destroying the bike. This means they have to carry a locked bike – risking looking suspicious and getting caught – making a ring lock a safer feature than it seems. Furthermore, locks that don’t require being tied to a physical structure have the ability to make bike parking more convenient, efficient, and space-saving in urban cityscapes. The Bollard rack – the standard bike rack in Boston – is a short vertical post with a circle to which bikes can be secured. (Fig. 7) While a Bollard rack provides a leaning structure for a bicycle, it can host two locked bikes at most; and measuring 190 x 90 cm, a Bollard rack takes up a substantial amount of space when used. (Boston Transportation Department 2016) In Copenhagen, the standard bike parking is a rack with rings, securing the front wheel and preventing the bicycle from falling over. (Fig. 8) A rack of this sort, fitted for five bicycles, measures only 140 x 32 cm, taking up substantially less space than its American counterpart. As a result, the city of Copenhagen has managed to fit 180,000 publicly available parking spots in the city, (Cycling Embassy of Denmark 2018) in comparison to Boston’s mere 3000 racks, recorded as of 2013. (Teitell 2018) In a city such as Boston, where space is limited, it’d be highly beneficial to equip bicycles with a ring lock, kickstands, and install Copenhagen-standard bike racks, to get more people biking. Being able to park exactly where you need to go without fearing that your bike is going to get stolen is currently a luxury for Bostonians, although in a bike-friendly city, that should be expected; and whereas bicycle parking is often left unnoticed to those who are not cyclists – to those who are, they make a big difference.
III. IMPROVING THE PUBLIC SPHERE & HUMAN INTERACTION
Good bicycle infrastructure can better human behavior and promote human interaction, which can make a city more livable, and its citizens happier. In “Happy City,” Charles Montgomery showcases empirical evidence that spending hours commuting by car decreases life satisfaction and that active commuting – such as walking or biking – improves psychological well-being. (Montgomery 2013, 228) The equation is quite simple: re-allocating street space from cars to bicycles equals more bikes and fewer cars, which equals less pollution, less noise, and a safer public space – something that sadly hasn’t been well-received in the car-centric continent of North America. In 2010, Toronto council member Rob Ford even went so far as to say that “roads are built for buses, cars, and trucks, not for people on bikes.” (Sadik-Khan 2016, 145) Contrary to Ford’s belief, however, cars have had a “dramatic worsening of conditions for pedestrians and bicycle traffic” (Gehl 2010, 92) around the world, taking their toll on the lively public life and the safety in public places, a concern American activist and urbanist legend Jane Jacobs brought up already in the mid 1900s. In order to keep a street safe, Jacobs argued, it has to have mixed functions that entices people to stay in the space, providing “eyes on the street.” (Jacobs 1961, 54) Eyes on the street don’t exist when the majority of the street is filled by cars, in which you are completely anonymous and unable to experience the spontaneous human interaction that inevitably happens otherwise – looking people in the eye, having to wait next to them to cross an intersection and maybe exchanging a word or two, or if you are a bicyclist, stretching your arm out to signal that you are turning. When driving, there is a certain anonymity and social exclusion; the automobile is a private entity after all. Whereas motorists can commute ‘unbothered’ – walking out of their home into their car, driving to work and entering an office – being a cyclist or pedestrian contributes to a city feeling more human by requiring a close connection to the urban cityscape. It is exactly this that in turn provides eyes on the street, making a street feel safer and more livable by Jacobs’ measures.
Applying this to Boston, where 46% commute by car – and where 39% of those are solo drivers (Walsh 2018) – seems like a challenge; but it doesn’t have to be. In 2013, Danish architect Jan Gehl noted: “if you make more road space, you get more cars. If you make more bike lanes, you get more bikes. If you make more space for people, you get more people and of course then you get public life.” (Gehl 2010) If bicycle infrastructure can be improved and expanded in Boston, more people will bike, which will in turn boost public life in the city. The hardest part is of course doing so. Sadly, as cars flourished in numbers and popularity in the mid 1900s, the bicycle was pushed aside to be seen less as a tool for transportation and more of a sport, making it inaccessible to many by culture and design. In the United States today, biking is heavily divided across both age and gender: with young men being the most prominent riders in the nation. (Florida 2017) However, by making the bicycle accessible to more people, by both improved infrastructure and bicycle design, but also education and advocacy, Boston has the potential to see a shift in culture and perceived attitudes towards the bicycle. Because the truth is, the bicycle is really a tool beneficial for everyone to use – and one that should be more readily accessible to most. With a safe infrastructure in place, it is not strange that most Danish children learn how to bike before the age of six, nor that the division between male and female bicyclists are almost equal (with women biking a few more trips on average.) (Ministry of Foreign Affairs Denmark 2018) By implementing some of the design features that have previously been discussed in this paper, Boston could achieve the same.
V. BOSTON AS A LIVABLE, BREATHABLE, & ACCESSIBLE CITY
By acknowledging the bicycle as a tool for both economic, socioeconomic, and environmental gain, prioritizing bicycle infrastructure in the future development of the city of Boston has the potential to transform a car-centric system into a safer and more livable city by simply being implemented. In an ever-changing and rapidly growing cityscape, this is something Boston ought to aim for to make the city more accessible to its inhabitants. By constructing wide curb-segregated bike lanes and by implementing transitory curb structures where this is not possible, Boston can build a strong foundation for new cyclists to thrive in safety and comfort. By changing the standards of bicycle accessories, locks, as well as re-thinking the design of bicycle parking, Boston can facilitate the bike ride for cyclists already existing in the city, making them feel recognized and incentivized to keep biking. By legitimizing bicycles and putting their presence on the streets, Boston can experience an increase in happiness and public interaction, adding a much-needed human touch to a currently hostile environment. All of this while saving money and decreasing both pollution and social exclusion.
Design has the ability to endlessly shape and govern over human decision making – whether we are conscious of it or not. Design defines people, and people define cities. If we want a livable, breathable, and accessible city – we need a city design that allows for its citizens to be sustainable, happy, and equal. For this, bicycles are just one of many solutions – but nevertheless a very important one, in which changes on both a macro and micro level have the ability to make a big difference.
References
Andersen, Travis. “Cyclist killed is identified as BU graduate student.” The Boston Globe, November 9, 2018. https://www.bostonglobe.com/metro/2018/11/09/pedestrian-hit-truck-seriously-hurt-near
museum-science//story.html target="_blank">story.html
Bambrick, Yvonne. The Urban Cycling Survival Guide. Toronto: ECW Press, 2015.
Boston Transportation Department. “Minimum Lane Widths in the City of Boston.” Last modified September 19, 2013. https://issuu.com/bostontransportationdepartment/docs/3_5.
Boston Transportation Department. Bike Parking. Boston: City of Boston, 2016. https://www.boston.gov/sites/default/files/document-file-08-2016/rack_installation_guidelines.pdf
Colville-Andersen, Mikael. Copenhagenize: The Definitive Guide to Global Bicycle Urbanism.
Washington: Island Press, 2018.
Cycling Embassy of Denmark. “First Every Priority Plan for Bicycle Parking in Copenhagen.” Last modified March 12, 2018. http://www.cycling-embassy.dk/2018/03/12/first-ever-priority-plan-bicycle-parking-copenhagen.
Cycling Embassy of Denmark. Copenhagen City of Cyclists – facts and figures 2017. Copenhagen: City of Copenhagen. http://www.cycling-embassy.dk/wp-content/uploads/2017/07/Velo-city_handout.pdf.
Department of Innovation and Technology. Vision Zero Fatality Records. V1. July 23, 2018. Distributed by the City of Boston, https://data.boston.gov/dataset/vision-zero-fatality-records.
Ellement, John R.“What the police report shows on the tragic crash in Back Bay that left bicyclist dead.” The Boston Globe, February 1, 2018.
https://www.bostonglobe.com/metro/2018/02/01/what-police-report-shows-tragic-crash-back-bay-that-left-bicyclist-dead/story.html
Florida, Richard. “Mapping America’s Bike Commuters.” Published May 19, 2017. https://www.citylab.com/transportation/2017/05/mapping-americas-bike-commuters/52923/.
Gehl, Jan. Cities for People. Washington: Island Press, 2010.
Jacobs, Jane. The Death and Life of Great American Cities. New York: Vintage Books, 1961.
Kabell, Morten. Copenhagen City of Cyclists: The Bicycle Account 2016. Copenhagen: Cycling Embassy of Denmark, 2018.
http://www.cycling-embassy.dk/wp-content/uploads/2018/02/CPH-Bicycle-Account-2016.pdf.
Lopez, Dahianna., Maria Cheevers, Pete Stidman, Daniel O’Brien. Bicycle Collisions in Boston, MA (2009-2012). V2. July 24, 2014. distributed by Harvard Dataverse. https://doi.org/10.7910/DVN/24713.
Ministry of Foreign Affairs of Denmark. “A nation of cyclists. Accessed December 12, 2018. https://denmark.dk/people-and-culture/biking.
Montgomery, Charles. Happy City. Toronto: DoubleDay Canada, 2013.
National Motorist Association and Massachusetts Institute of Technology. “How fast is traffic?” Accessed December 12, 2018. http://www.mit.edu/~jfc/NMA/limits.html.
Sadik-Khan, Janette, and Seth Solomonow. Streetfight. New York: Penguin Books, 2016.
Statistics Denmark. “Injured and killed in road traffic accidents by casualty, region and time.” Accessed December 11, 2018. http://www.statbank.dk/statbank5a/default.asp?w=1440.
Statistics Denmark. “Population in Denmark, Q4 2018” Accessed December 11, 2018,
https://www.dst.dk/en/Statistik/emner/befolkning-og-valg/befolkning-og-befolkningsfromskrivning/folketal.
Teitell, Beth. “Like motorists, bike riders scramble for places.” The Boston Globe, July 7, 2018.
https://www.bostonglobe.com/lifestyle/health-wellness/2013/07/07/new-kind-problem-where-park-your-bike/830w8eN7YVDZDublGfwVhL/story.html.
US Census Bureau. “QuickFacts: Boston City, Massachusetts.” Accessed December 11, 2018. https://www.census.gov/quickfacts/bostoncitymassachusetts.
Walsh, Martin J. 2017 Boston Bicycle Counts: Measuring how many people ride bikes in the
City. Boston: City of Boston Transportation Department. https://www.boston.gov/sites/default/files/document-file-02-2018/2017_boston_bike_counts_report.pdf
Walsh, Martin J. Go Boston 2030: Vision and Action Plan. Boston: Boston Transportation
Department, 2017. https://www.boston.gov/sites/default/files/document-file-03-2017/go_boston_2030_-_full_report_to_view.pdf.